Coordinated Omission
Every time I measure something new I feel like I’m always learning about how hardware interacts with software architecture and how distributed systems interact with each other. I’ve measured a lot of things over my career. Here are a few things I’m proud of working on.
- One of the worlds first
1,000 nodeCassandra+Solr clusters a decade ago. - The first 1+ million CPU core Kubernetes cluster with 55,000 nodes that I’m aware of.
If there’s one thing I’ve learned when operating SaaS systems it’s that you need to become a black belt at finding a needle in a haystack and accurate results are critical. One of the most frequent issues organizations struggle with is how to keep their largest customers happy since they are the ones paying the most but also suffering the most due to their abnormally large workloads on your product.
When you do not truly understand your customer experience, you lose the ability to be proactive and end up constantly reacting to fires and support calming down upset customers.
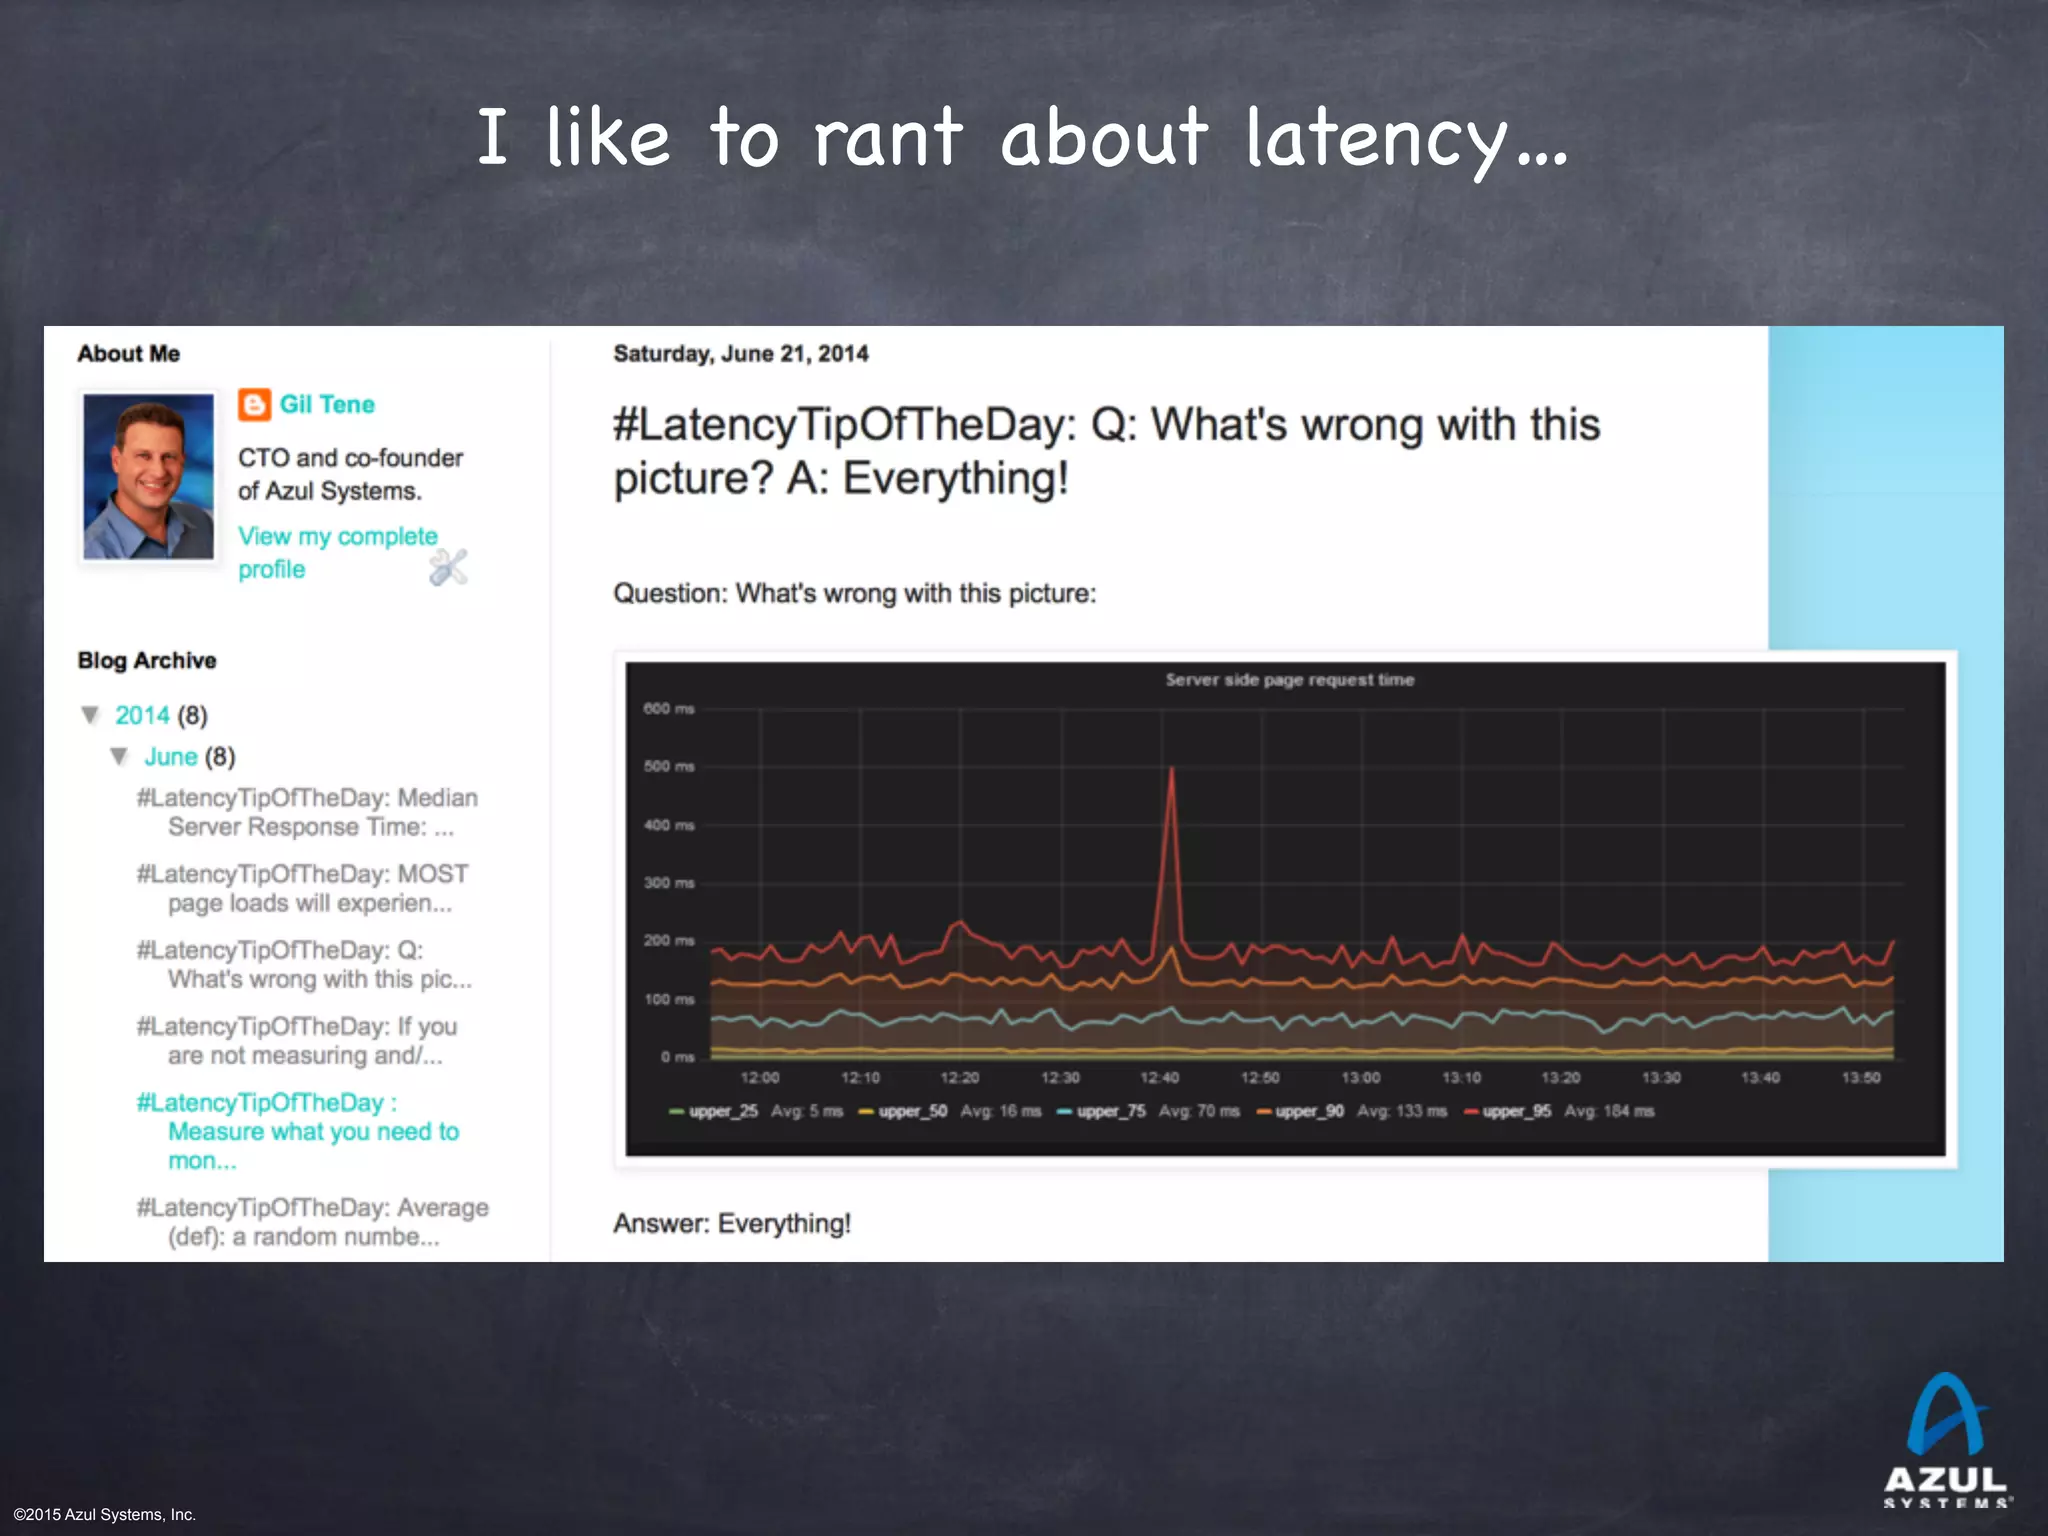
One of the challenges when measuring a system is correctly accounting for Coordinated Omission which is a subtle but impactful effect that commonly skews benchmark results without testers noticing. I first heard about Coordinated Omission in 2014 by Gil Tene in his how not to measure latency. He works on a proprietary Java runtime and garbage collector known to be one of the fastest and lowest latency runtimes and GC’s in the industry. He knows a thing or two about measuring latency.
What is Coordinated Omission?
Coordinated Omission is a side effect where a testing tool is accidentally coordinating with the system being measured causing anomalies in the request start times which results in incorrect reporting of response times.
Unfortunately most popular testing tools incorrectly implement how to capture the request start time which makes these tools untrustable for reporting correct results.
This subtle bug makes the testing tool vulnerable to Coordinated Omission and the target system being measured will affect the testing tool in a way that makes response times look deceptively optimistic. This is extremely common in many tools and hides that real response times are much worse than reported.
If you’re generating traffic but unable to reproduce production like results that match the complaints from your customers, its possible the tool you’re using isn’t measuring correctly and your results
are being skewed by Coordinated Omission. Your response time percentiles like p75, p90, p95 and p99 will report much better than they actually are. Sometimes the customers raising the most hell are in that 1-25% of traffic that’s being reported incorrectly.
This can cause you the following pain.
- Before you release you may have a false sense of comfort from your pre-release testing and experience unforseen issues on launch.
- You may start to not trust the customer complaints because you are unable to reproduce the issue.
- You may have a test workload created correctly to reproduce the issue you’re investigating but you don’t know it so you keep experimenting wasting time.
- You may measure a bug fix, believe you fixed it for your customers and then they still complain.
Figure 1. Corrected for Coordinated Omission vs Uncorrected Data.
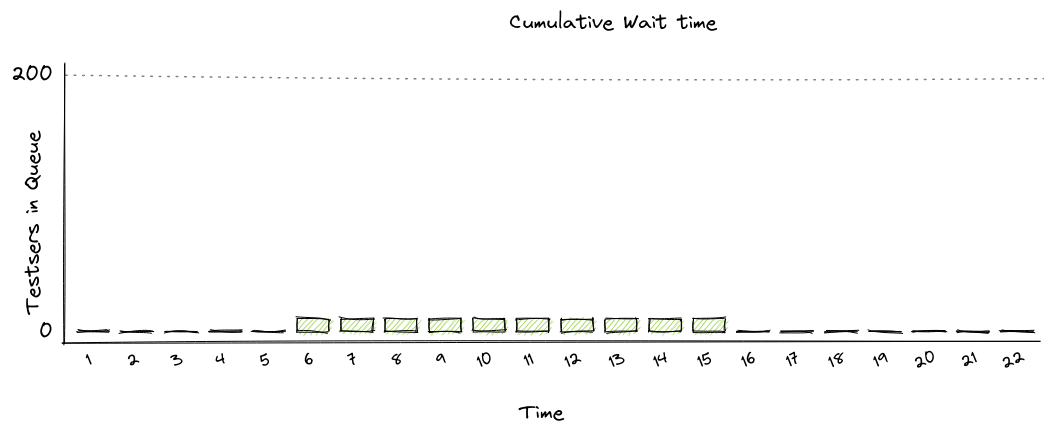 Figure 2. How many tools not correcting for Coordinated Omission report response times.
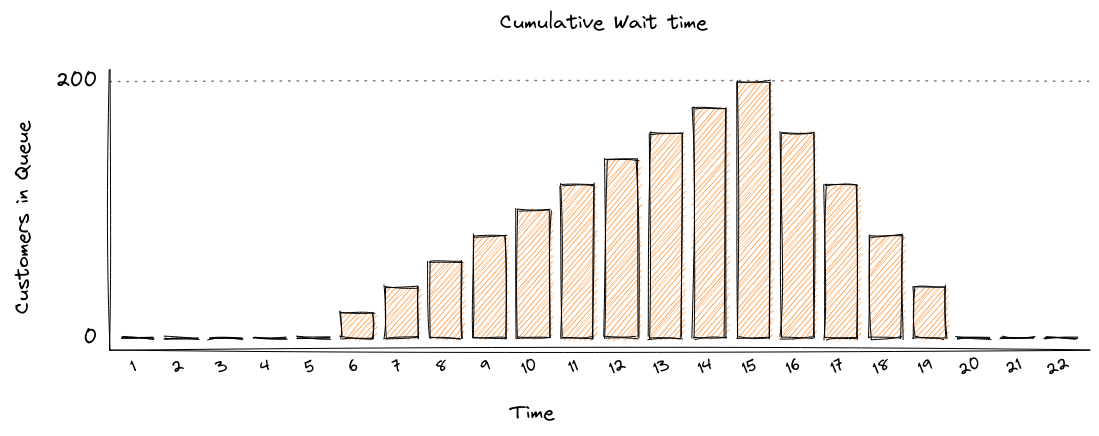 Figure 3. Actual response times experienced by users.
The bugs that cause this kind of vulnerability are subtle and common but as you can see in Figure 1, 2 and 3 the results are not subtle at all and have a signifigant impact on the results and will influence how you make your decisions.
Causes
Typically testing tools will create the configured number of clients on the configured number of threads and will send requests at the desired requests per second rate. Where things go wrong in the measurements is that each request start time is calculated independent of the previous requests ignoring the effects caused by back pressure. Any spike or stall that causes response times to rise will be misrepresented and will accidentally alter the speed and pace the testing tool dispatches requests.
This means the target system being tested is having a side effect on how the testing tool is measuring and dispatching the workload.
What can you do to measure correctly?
Some advice you might find is that if you run every client in a separate thread the dependency of each request will suffer from backpressure less and more accurately model how users use the system since User A does not coordinate with User B. For example in JMeter the following recommendation is documented in the JMeter manual.
As with any Load Testing tool, if you don’t correctly size the number of threads, you will face the “Coordinated Omission” problem which can give you wrong or inaccurate results. If you need large-scale load testing, consider running multiple CLI JMeter instances on multiple machines using distributed mode (or not).
JMeter Manual
Unfortuantely this advice is still vulnerable to Coordinated Omission. Putting each virtual client in a separate thread only reduces the chances of the benchmarking tool accidentally coordinating with the system under test because each request depends on each other less and puts the responsibility on the OS and CPU to schedule them more concurrently. This doesn’t correct that each virtual clients thread is still a queue dispatching requests at a rate that can be manipulated by the system under test.
You can’t configure your way to correcting for Coordinated Omission. If you’re measuring a 1 request per second a benchmarking tool needs to do the following to accurately measure response times.
- It needs to send a constant rate of requests and not accidentally coordinate with the target system.
- The request start time should represent when it was scheduled to run, not when it actually ran so that response time can be calculated correctly.
What tools do I recommend?
Unfortunately most benchmarking tools are vulnerable to inaccurate results and actually synchronize with the system under test allowing the target system to accidentally orchestrate the benchmarking tool. To correct for this problem the testing tool needs to be designed in a way that takes special care in how it dispatches requests and how it tracks the request start time and end time. The 2 key design considerations are the following.
- The testing tool needs to send a constant rate of requests and prevent accidentally being orchestrated by the system under test due to back pressure.
- The request start time needs to be when that request should have been dispatched based on the rate so that back pressure delays are represented not hidden.
Both points are extremely important to accurate results as mentioned by Gil Tene. Many benchmarking tools calculate response time based on a request start time of when the request was sent not when it should have been sent based on the rate.
This is not an exhaustive list but here are some tools I’m aware of that correct for Coordinated Omission.
- Wrk2
Wrkwas a tool used by the Techempower industry leaders in HTTP benchmarking and used by the Microsoft ASP.NET team. Wrk was vulnerable to Coordinated Omission and Gil Tene contributed this fork calledWrk2that has changed how Techempower, Microsoft and many other companies in the industry measure response times. - Hyperfoil Reports backpressure.