Visualizing Postgres EXPLAIN ANALYZE to rapidly troubleshoot queries
I work with a lot of database types and while I love my terminal, at times I find visualizations can make things clearer faster especially when I sometimes don’t remember all the details involved. I was working with an extremely large query in a Postgres database and I decided to hunt for any visualization tools that might exist to help me understand this problematic query much faster.
I found a really helpful visualizer called PEV2. PEV2 is a single HTML page you can download and open in your browser without the need of a web server. The page prompts you to paste both the query and the EXPLAIN ANALYZE output of the query.
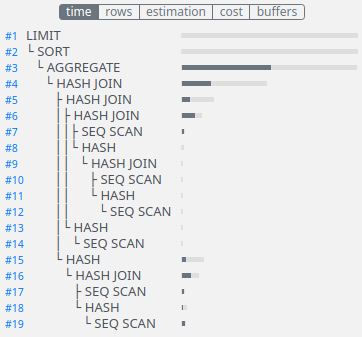
Figure 1. PEV2 left panel.
In Figure 1 on the left hand side of the UI you get the sequence tree of operations that executed with their duration shown.
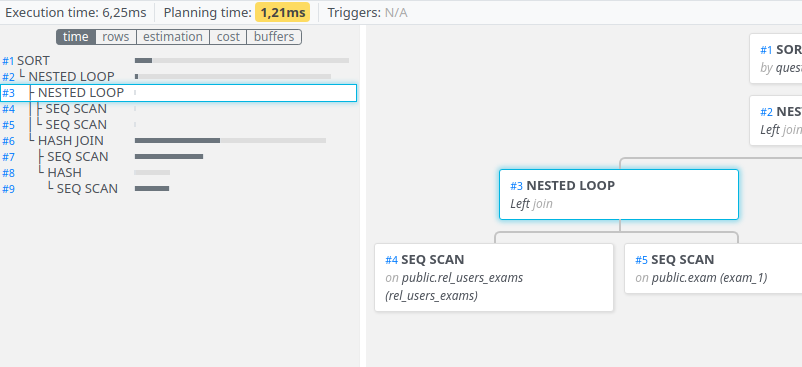
Figure 2. PEV2 right panel.
On the right side shown in Figure 2 of the screen we get a visual of the operation tree.
As always I like to thank people for the tools they open source. Thank you DALIBO for your work on PEV2. I’ve really enjoyed how easily PEV2 makes all the information I need available to troubleshoot queries.