Octane JSON benchmarks
Last week I announced Octane along with some results from the Techempower plaintext benchmarks that I ran on my bare metal servers. This week I’m publishing results of the json benchmarks. There is a PR pending that will add this benchmark to be independently run by Techempower in round 14.
Just like last time, I’m comparing performance with libreactor.
Benchmark hardware
Both client and server machines have identical hardware.
- 20 Intel(R) Xeon(R) CPU E5-2660 v3 @ 2.60GHz physical cores.
- 128GB of memory.
- 20GbE network.
Throughput results
I’m including plaintext results here so we can see how they compare to the json benchmarks.
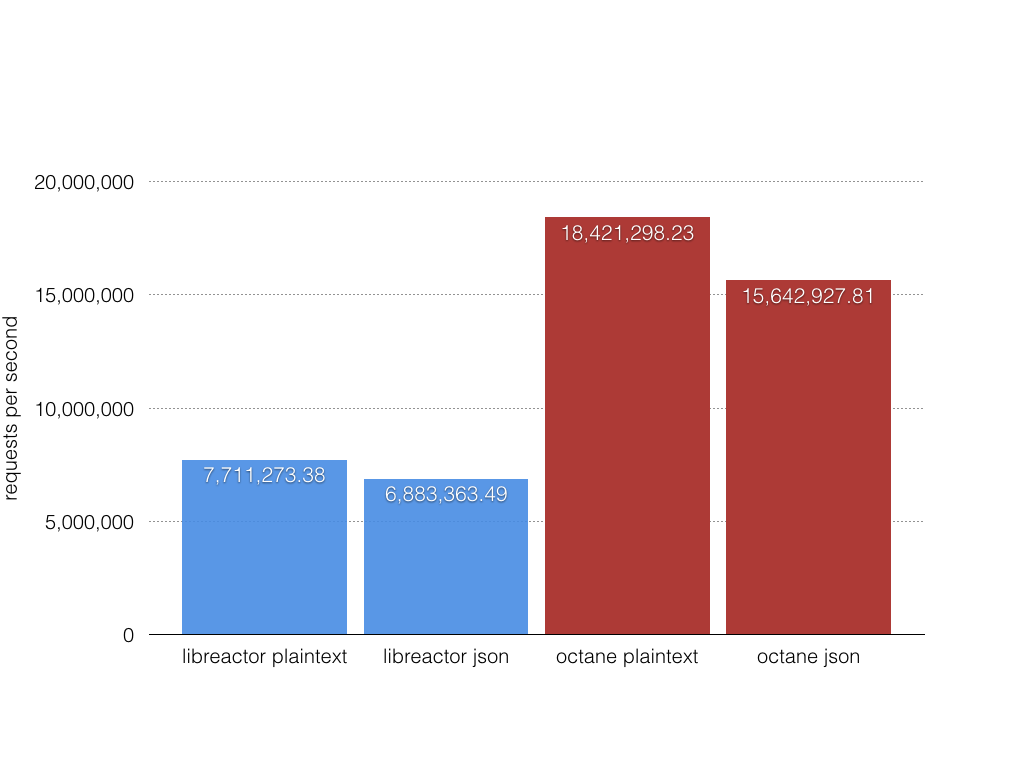 Figure 1. Throughput requests per second.
libreactor
An important note is that libreactor had better results this time than the previous benchmarks from last week.
Running 5m test @ http://server:8080/plaintext
  20 threads and 256 connections
  2,314,163,089 requests in 5.00m, 271.56GB read
Requests/sec: 7,711,273.38
Transfer/sec:      0.90GB

Running 5m test @ http://server:8080/json
  20 threads and 256 connections
  2,065,676,424 requests in 5.00m, 280.88GB read
Requests/sec: 6,883,363.49
Transfer/sec:      0.94GB
octane
Running 5m test @ http://server:8000/plaintext
  20 threads and 256 connections
  5,532,072,679 requests in 5.01m, 649.15GB read
Requests/sec: 18,421,298.23
Transfer/sec:      2.16GB

Running 5m test @ http://server:8000/json
  20 threads and 256 connections
  4,699,969,799 requests in 5.01m, 639.05GB read
Requests/sec: 15,642,927.81
Transfer/sec:      2.13GB
Latency distribution results
Measured using wrk2 from Gil Tene to properly account for coordinated omission to get correct latency results (latency results measured by Techempower are invalid).
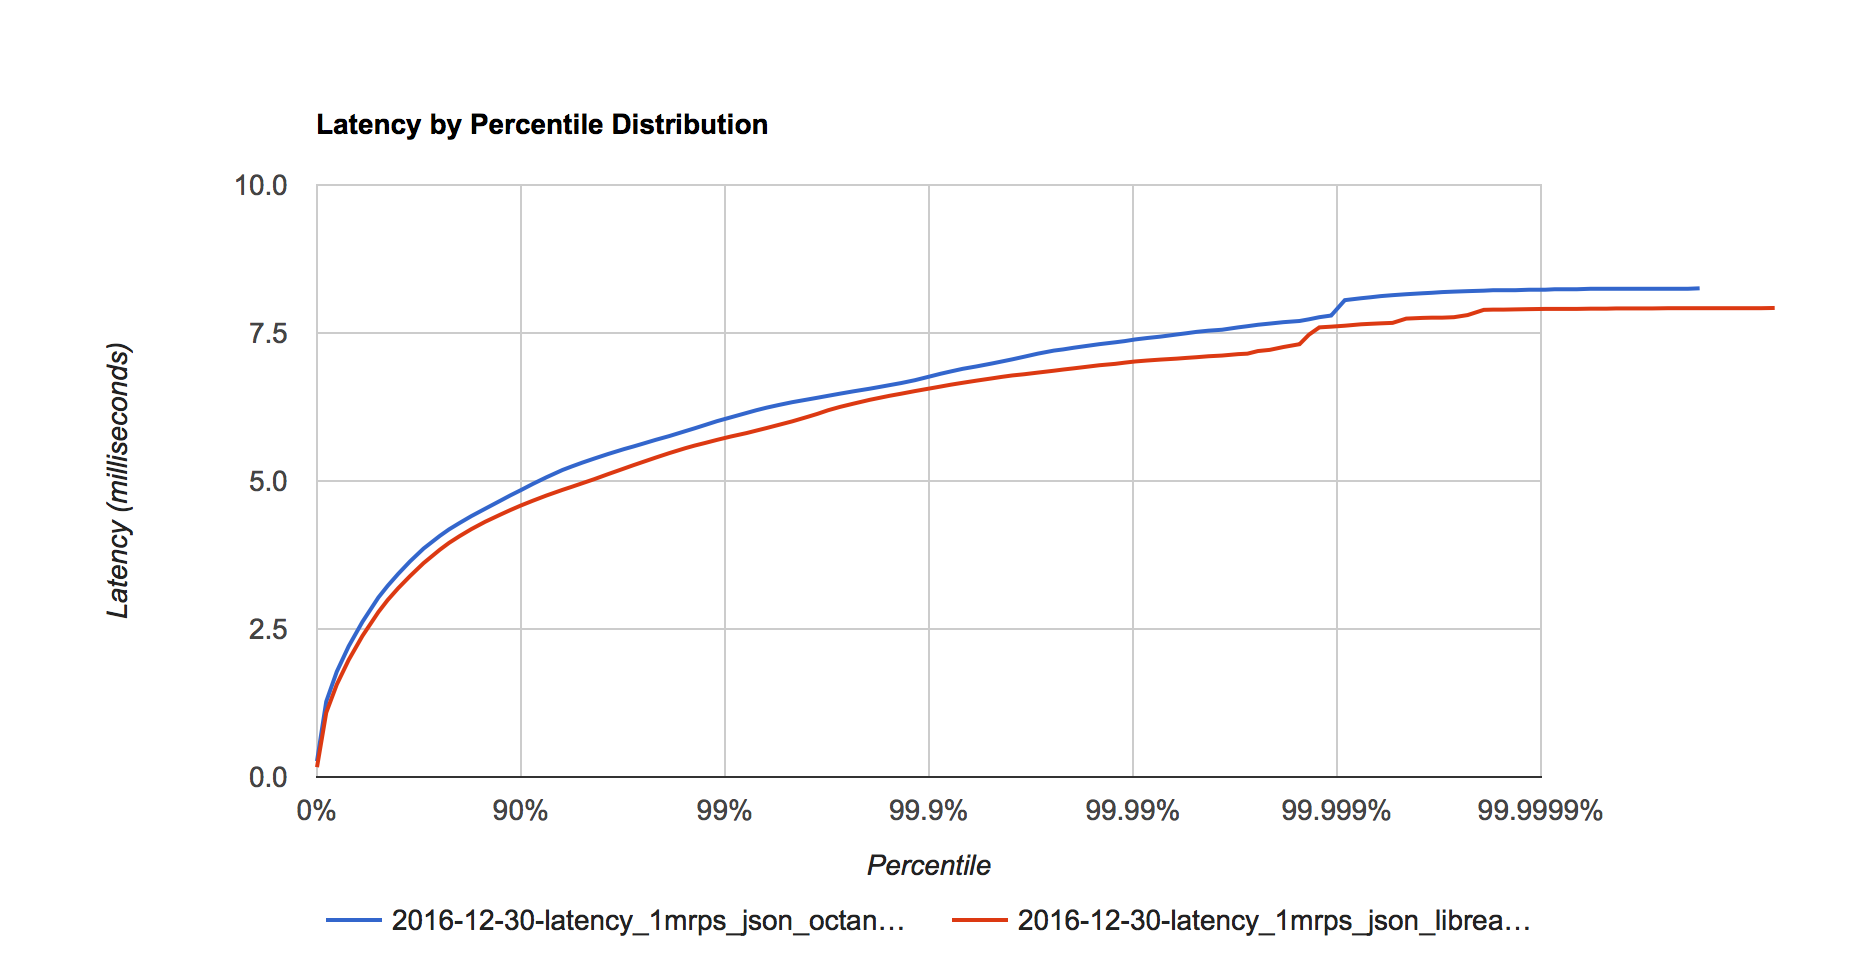 Figure 2. Latency distribution at 1 million requests per second.
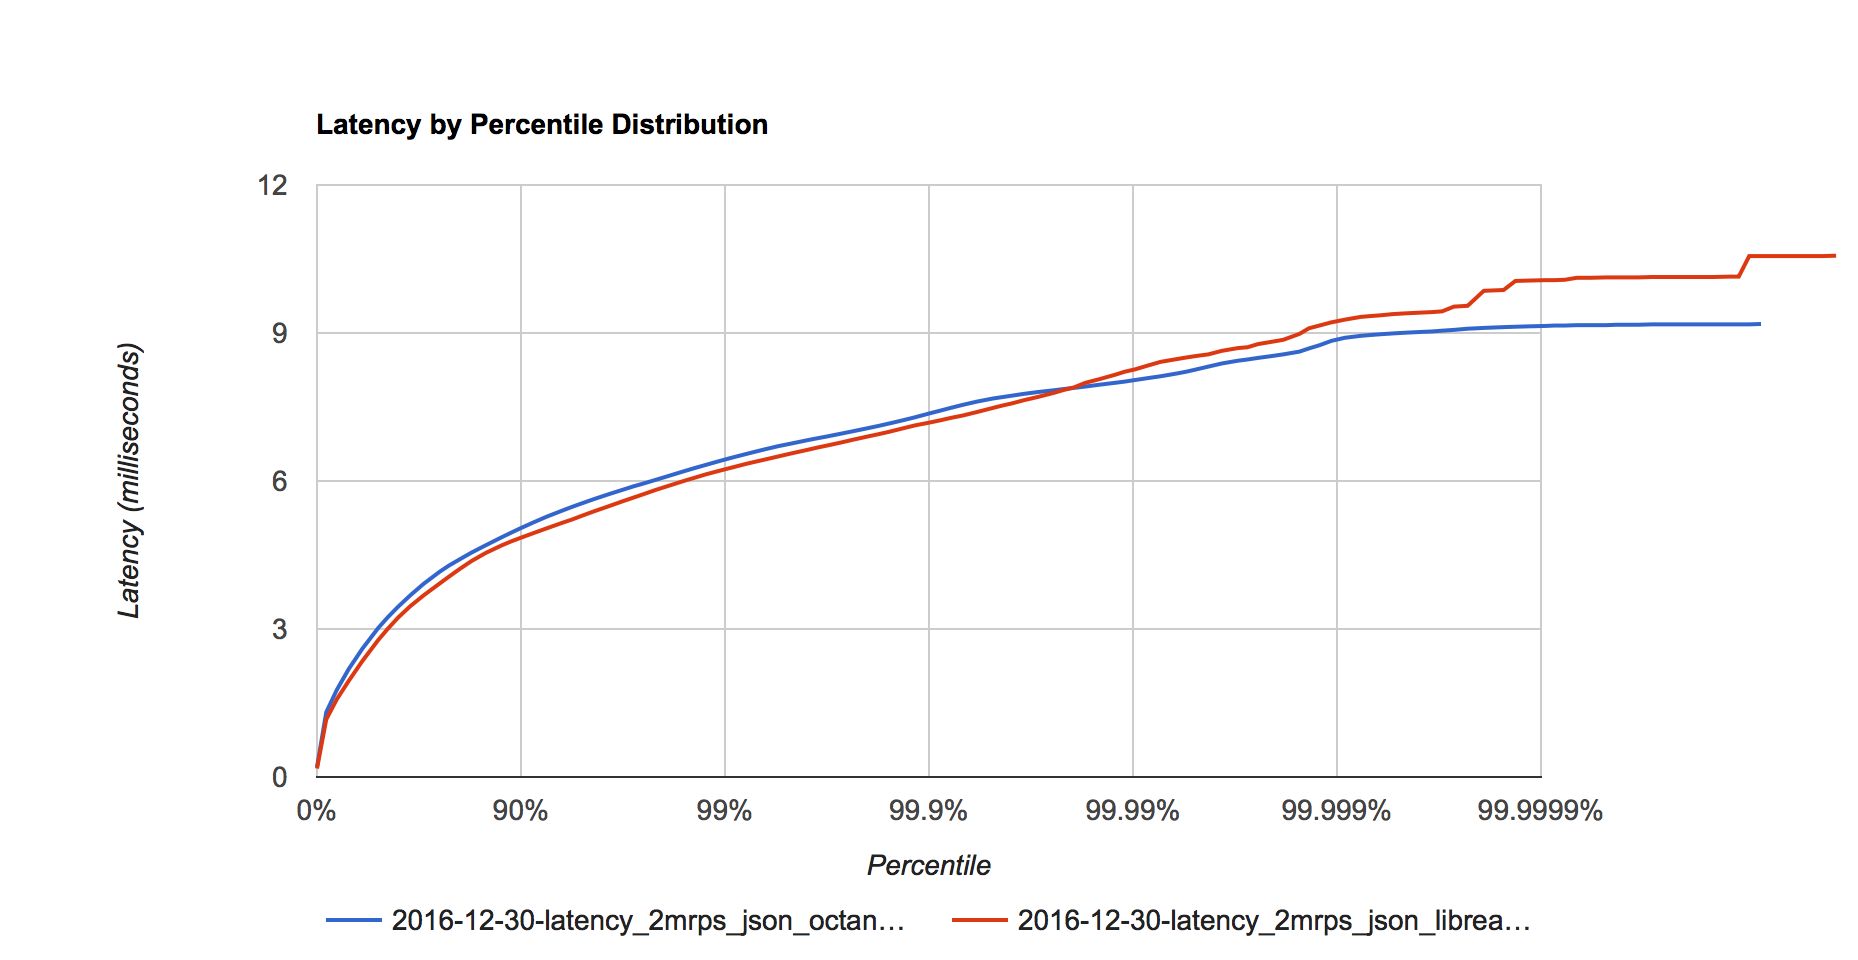 Figure 3. Latency distribution at 2 million requests per second.
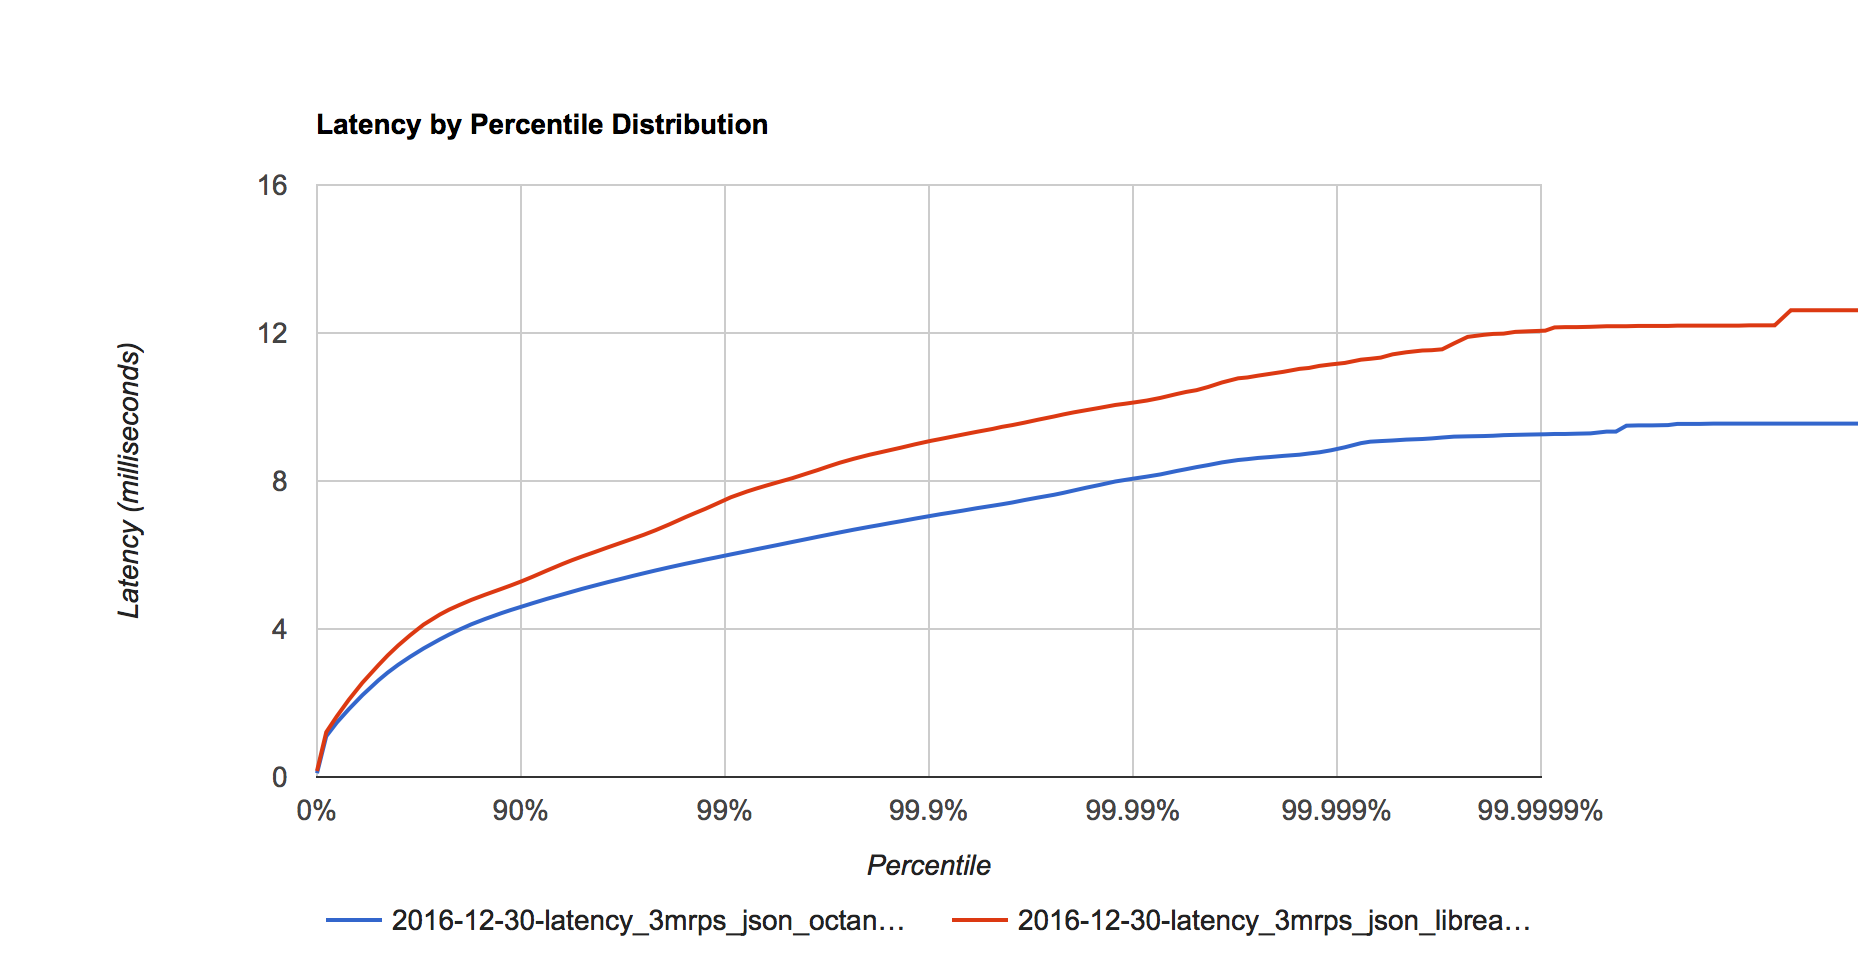 Figure 4. Latency distribution at 3 million requests per second.
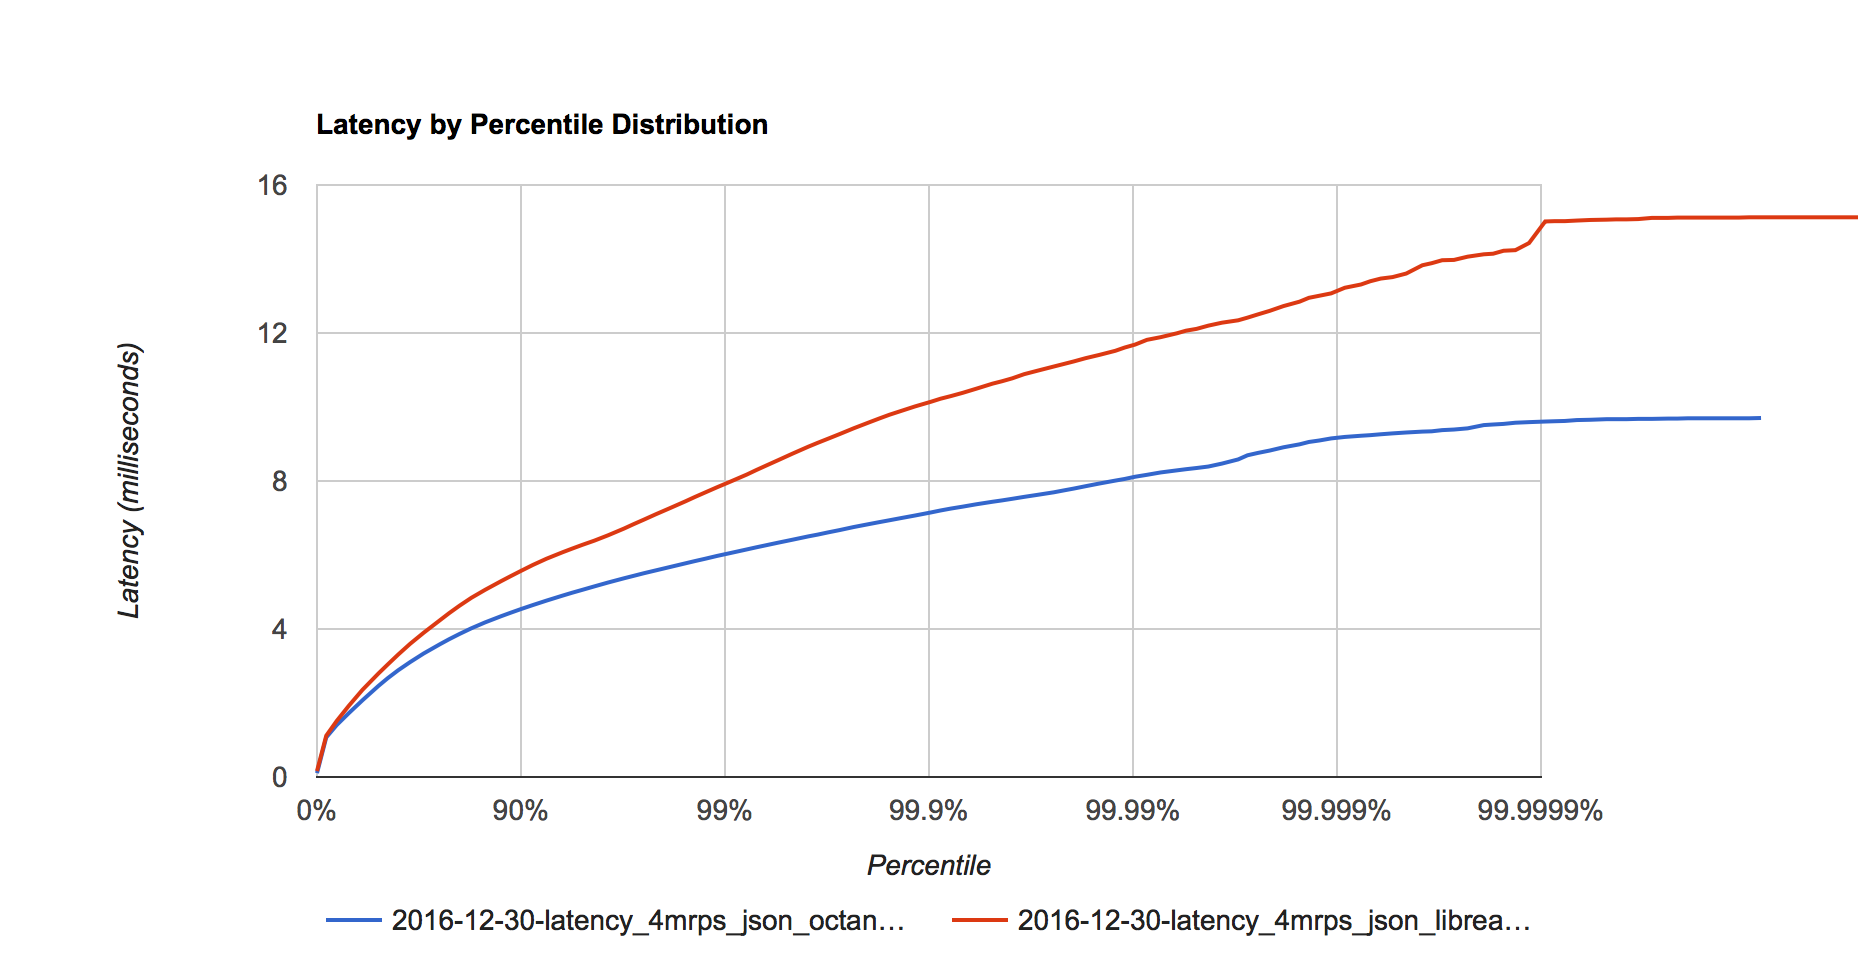 Figure 5. Latency distribution at 4 million requests per second.
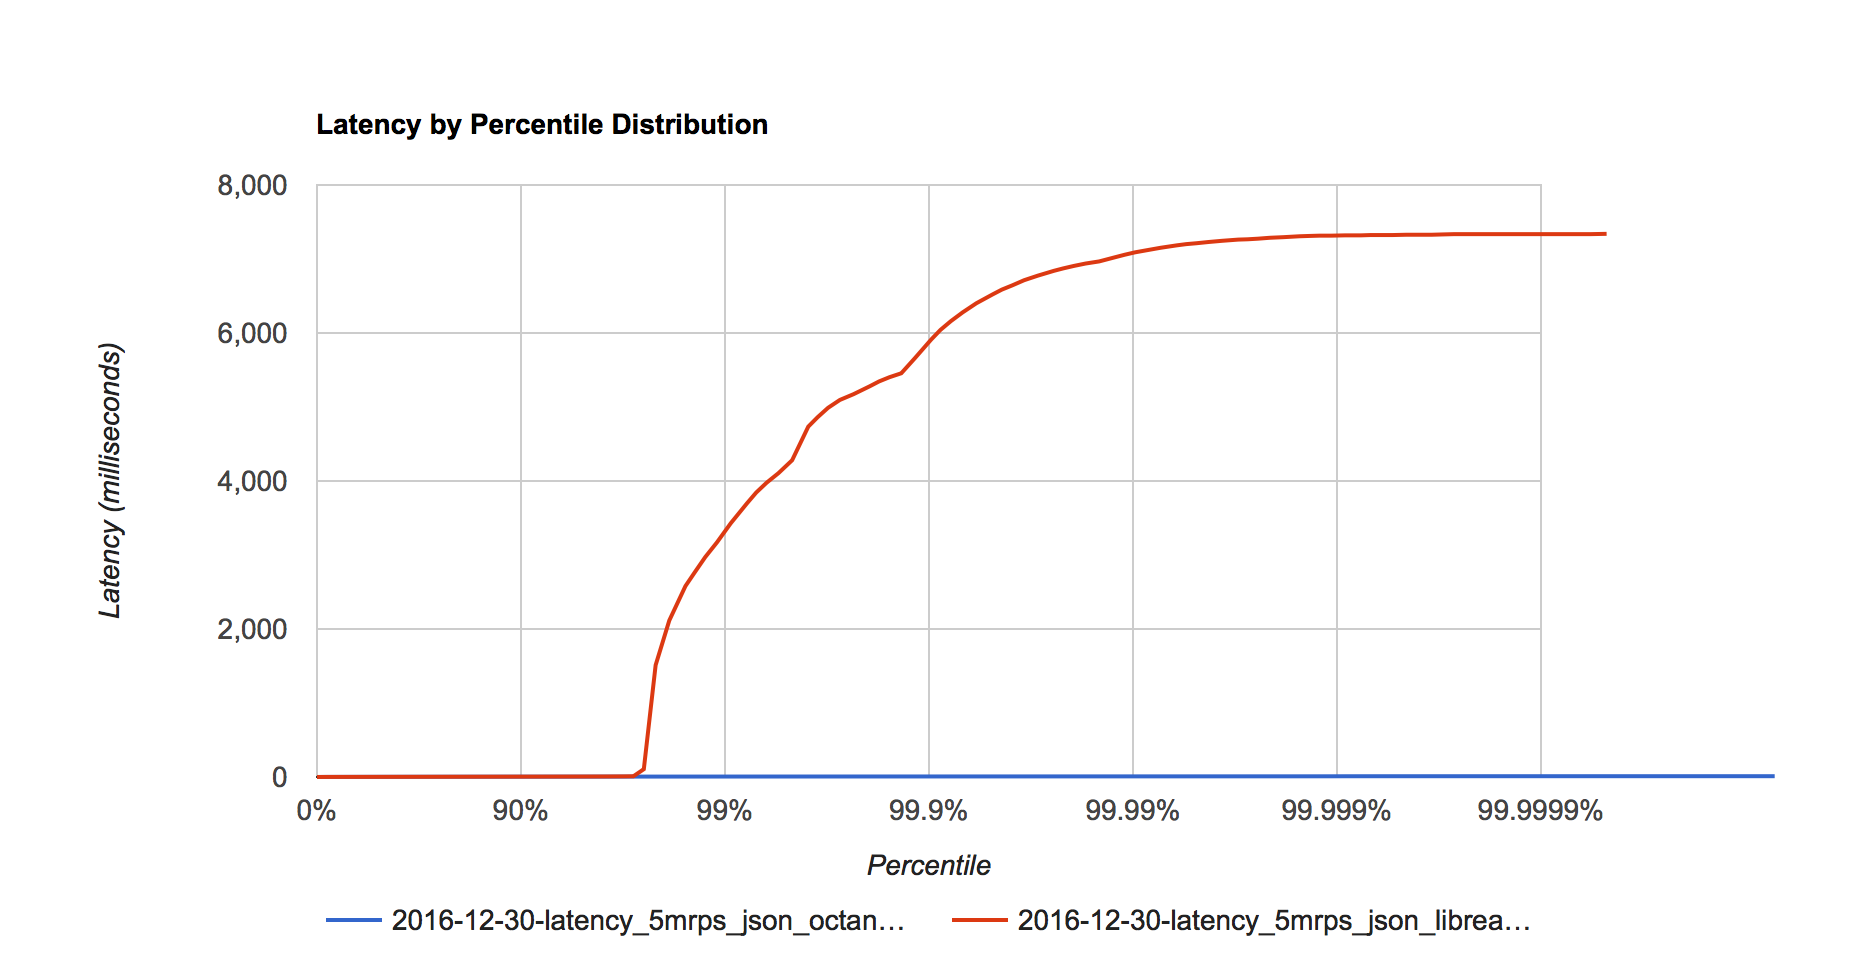 Figure 6. Latency distribution at 5 million requests per second.
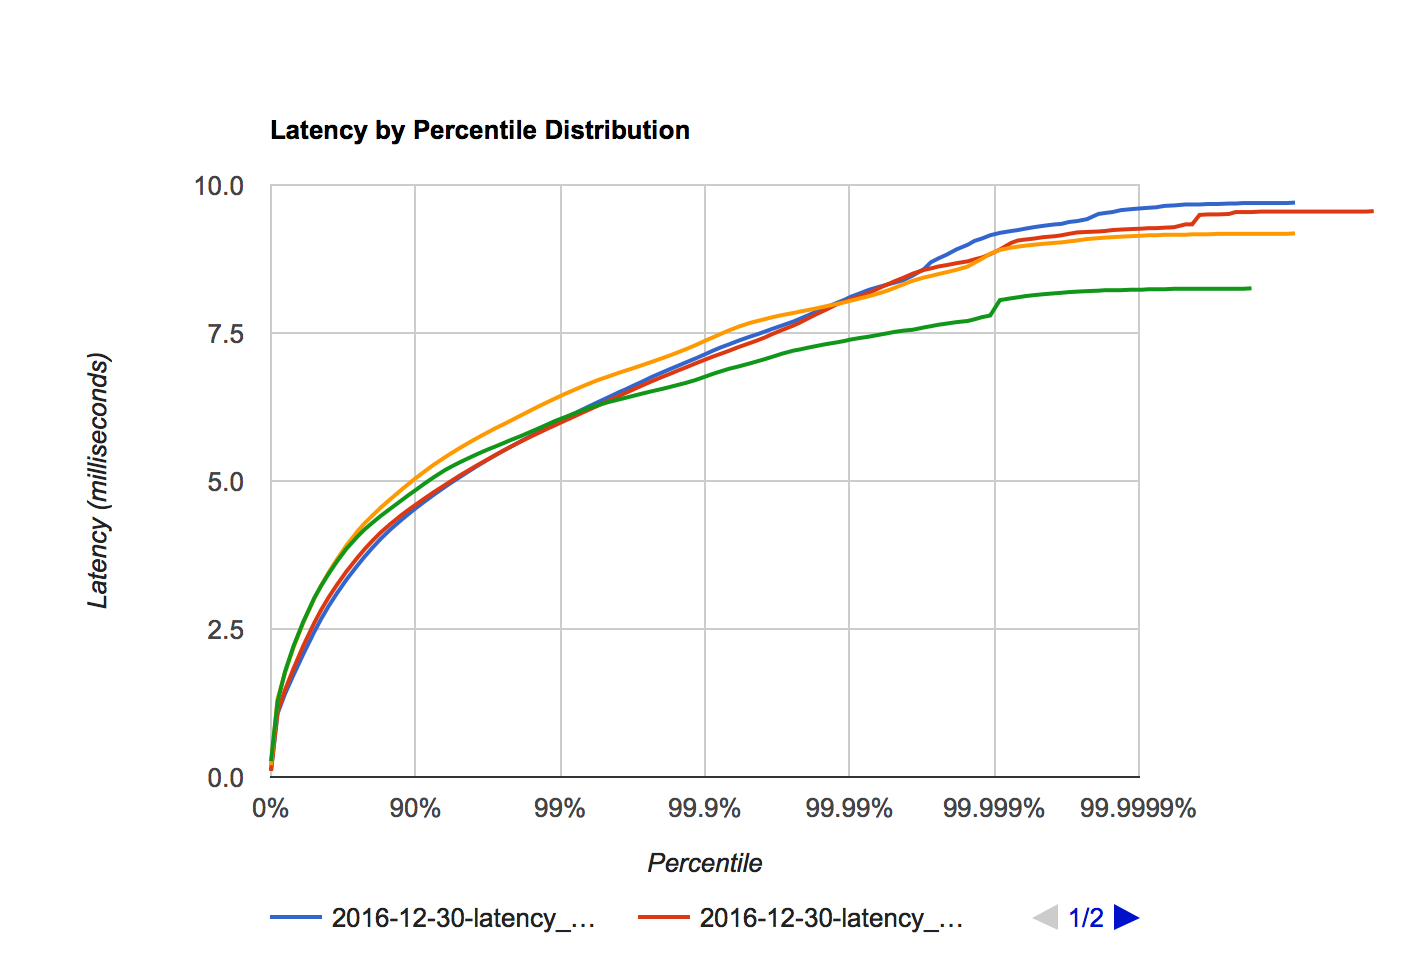
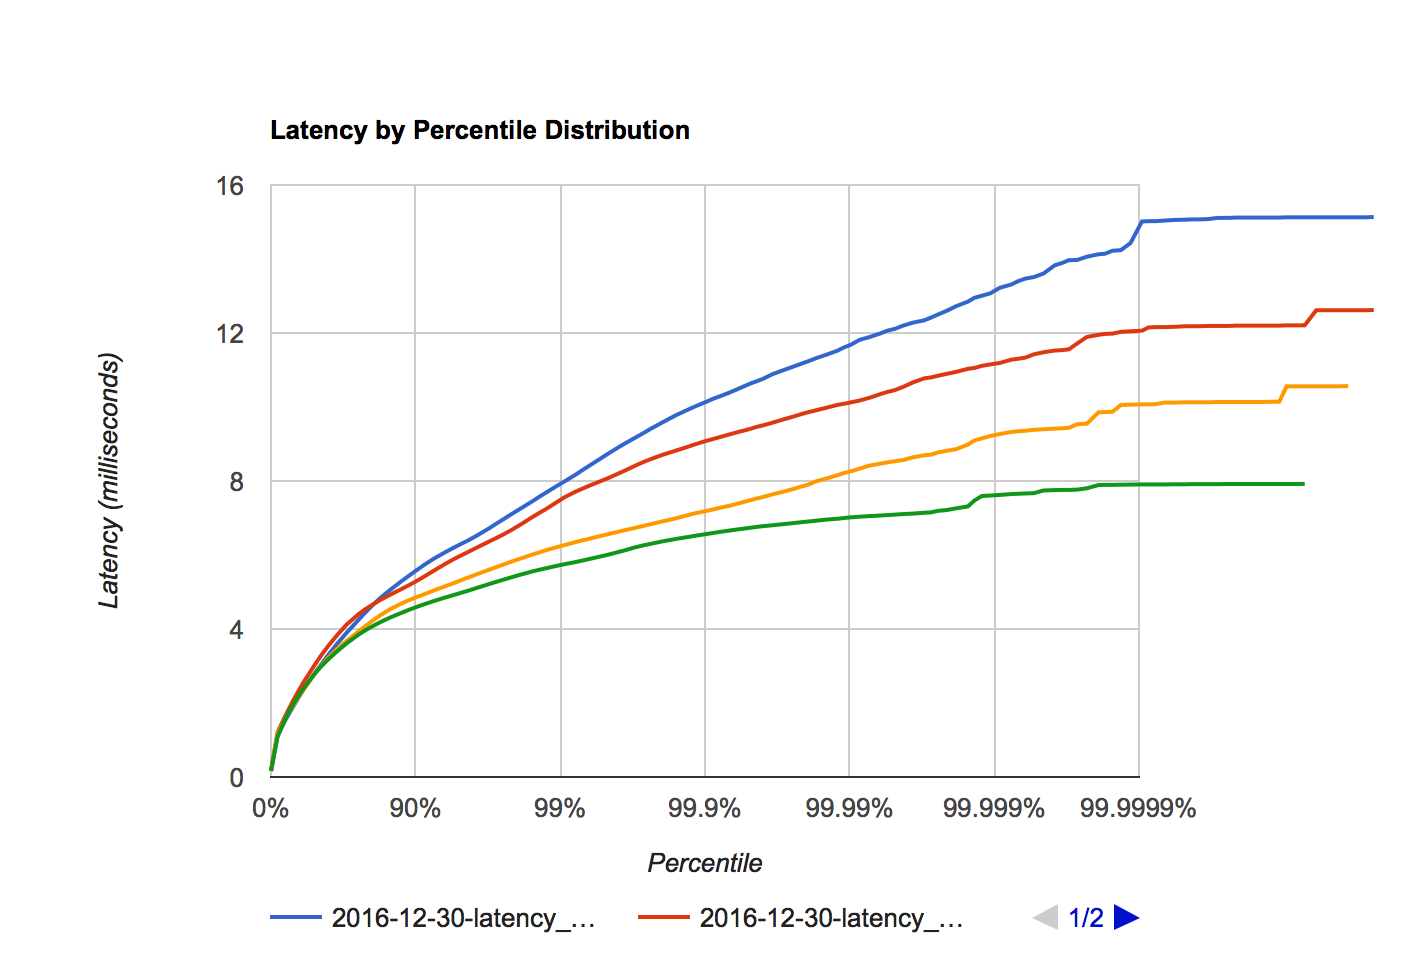
Figure 7a. Octane latency distribution at 1, 2, 3, and 4 million requests per second.
Figure 7b. libreactor latency distribution at 1, 2, 3 and 4 million requests per second.
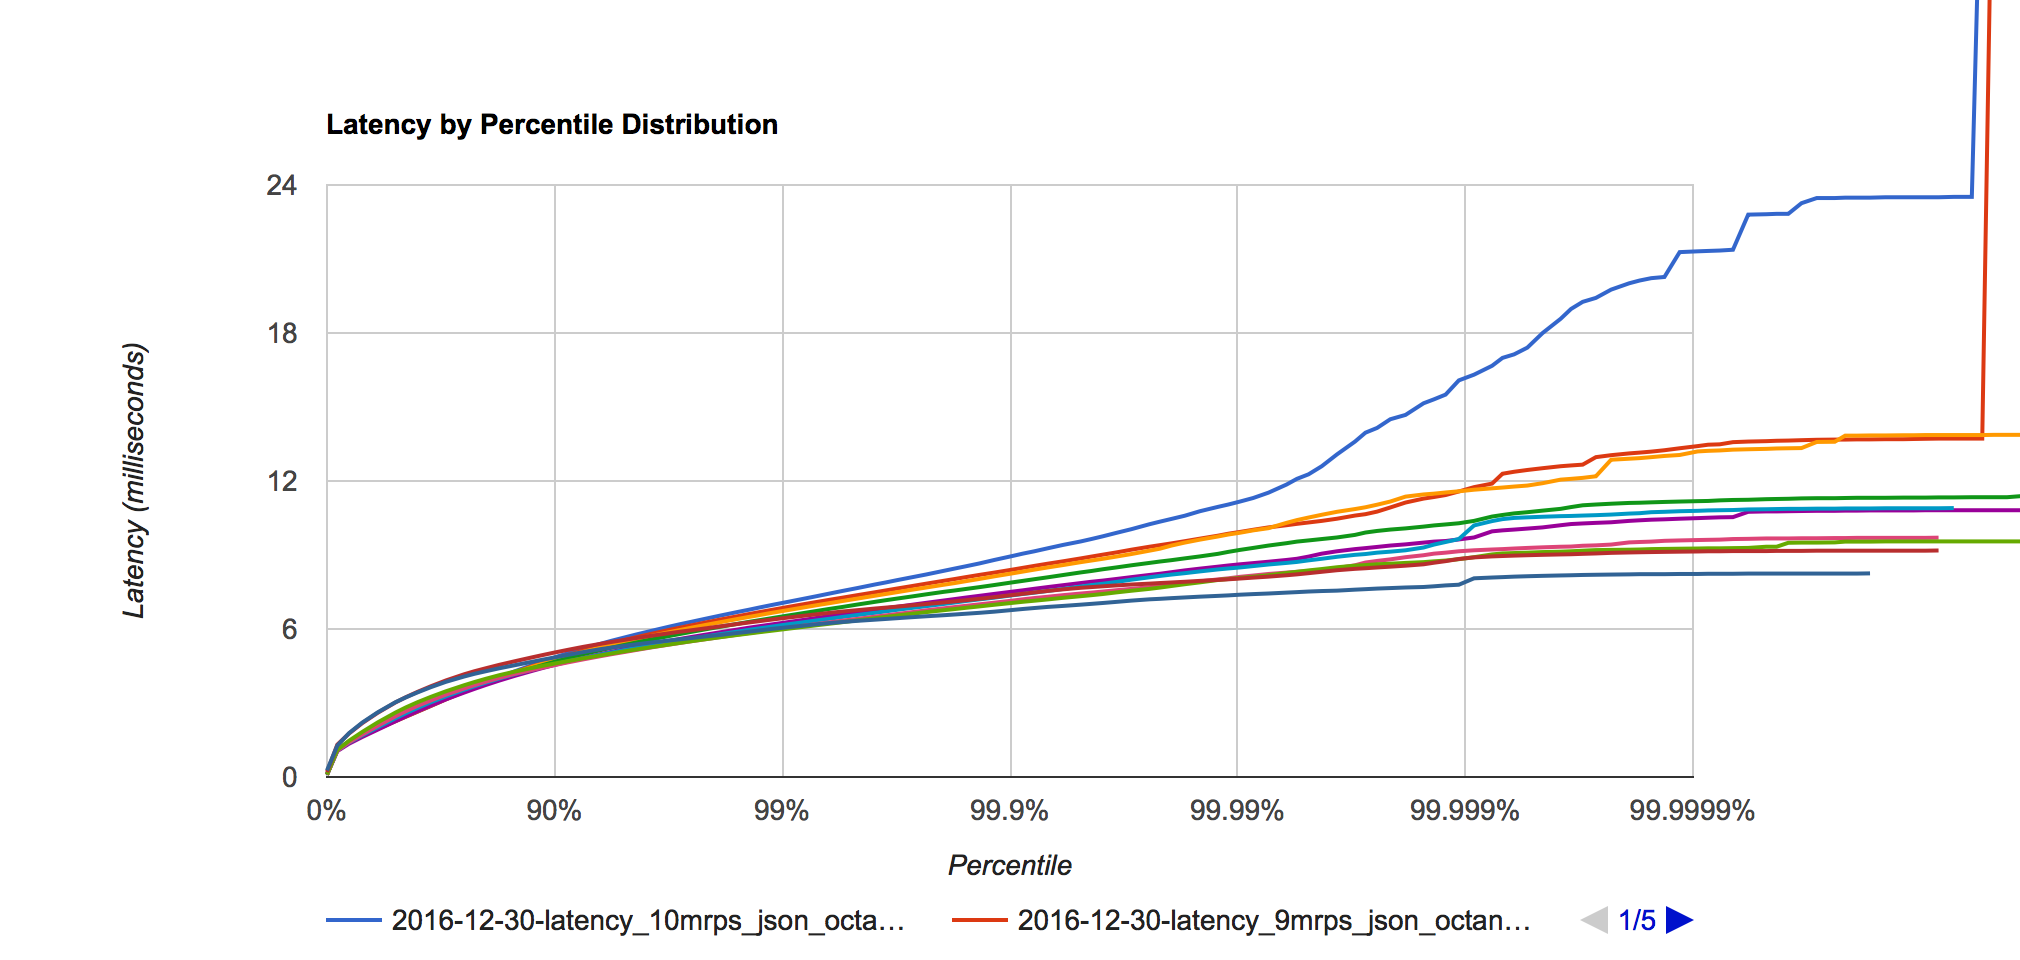 Figure 8. Octane latency distribution at 1, 2, 3, 4, 5, 6, 7, 8, 9 and 10 million requests per second.
Final comments
Octane still shows it’s performance gap that it showed in the plaintext benchmarks in these JSON benchmarks. At 99.99 percentile the 1-10 million requests/second range shows a latency distribution still quite narrow at 7.4ms at 1 million requests/second and 11.1ms at 10 million requests/second.
At 9 million requests/second latency distribution looks good but at 10 million requests/second the latency starts to degrade in the 99.999 and 99.9999 percentiles.