Announcing octane

Performance has always been one of my interests and I’ve been wanting for a long time to write a high performance networking library to use for when high throughput and low latency is a priority. I really like libuv however by default it only offers N:1 I/O threads to event loop threads. This makes it hard to scale to modern many-core systems unless you deploy multiple processes per system. I want something I can scale to the physical CPU cores available in a single process.
Today I’m announcing Octane which extends libuv to provide this scalability. I’ve chosen to add octane to the Techempower plaintext HTTP benchmarks so that it can be measured against the worlds fastest HTTP servers in an independent benchmark. My PR should be completed and merged in time for round 14.
Ahead of round 14 I wanted to post my own benchmarks so I can give a bit of an idea of the kind of performance octane offers.
Benchmark hardware
Both client and server machines have identical hardware.
- 20 Intel(R) Xeon(R) CPU E5-2660 v3 @ 2.60GHz physical cores.
- 128GB of memory.
- 20GbE network.
Throughput results
In round 13 libreactor was the clear winner of the plaintext benchmark so I benchmarked against it.
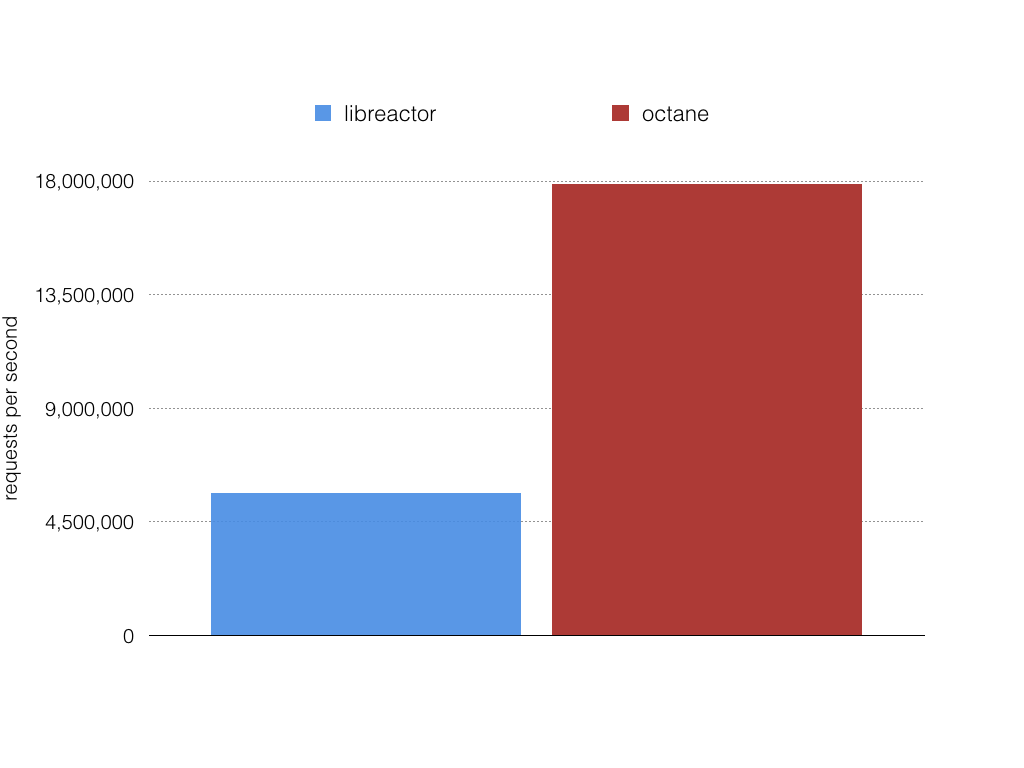 Figure 1. Throughput requests per second.
libreactor
While libreactor is fast the CPU utilization was 75% idle during this benchmark even though network throughput was 3x less than octane can reach. This indicates to me libreactor is not scaling to use all the performance available on the machine and the network.
Running 5m test @ http://server:8080/plaintext
  20 threads and 256 connections
  1,688,131,541 requests in 5.00m, 198.10GB read
Requests/sec: 5,625,172.18
Transfer/sec:    675.94MB
octane
Running 5m test @ http://server:8000
  20 threads and 256 connections
  5,406,003,387 requests in 5.00m, 639.39GB read
  Socket errors: connect 0, read 4994, write 0, timeout 0
Requests/sec: 18,013,816.64
Transfer/sec:      2.13GB
Latency distribution results
Measured using wrk2 from Gil Tene to properly account for coordinated omission to get correct latency results (latency results measured by Techempower are invalid).
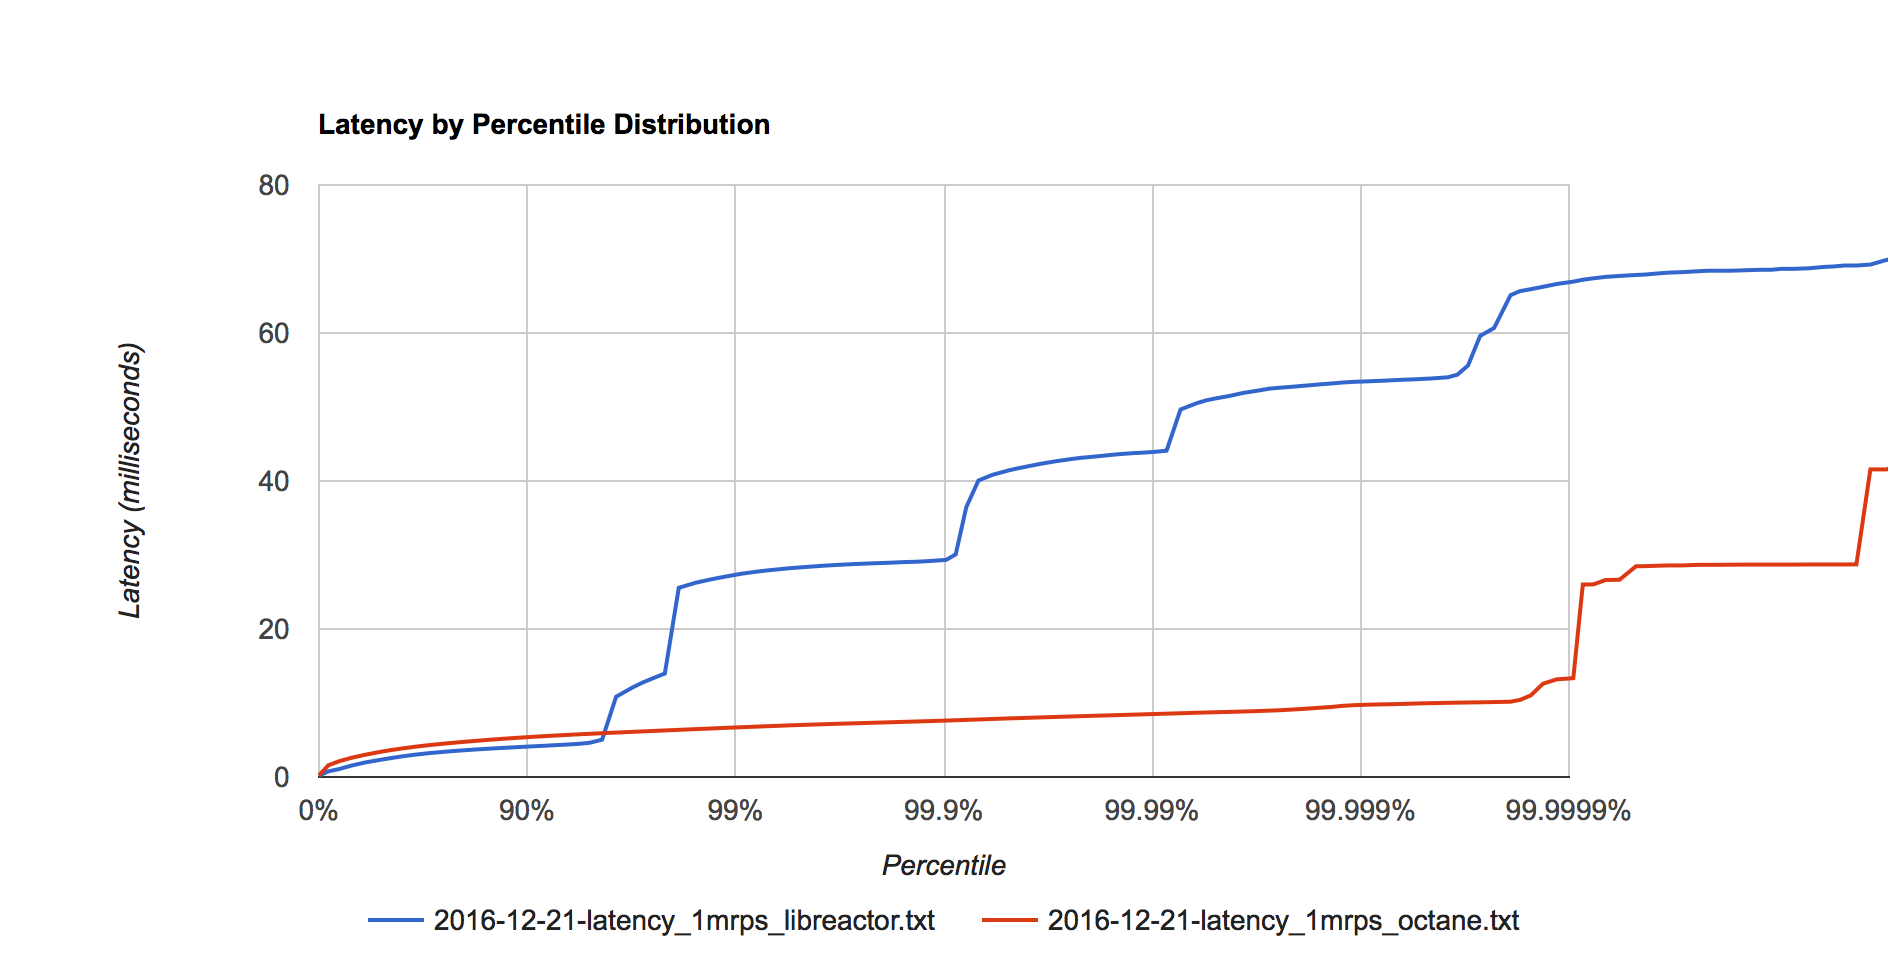 Figure 2. Latency distribution at 1 million requests per second.
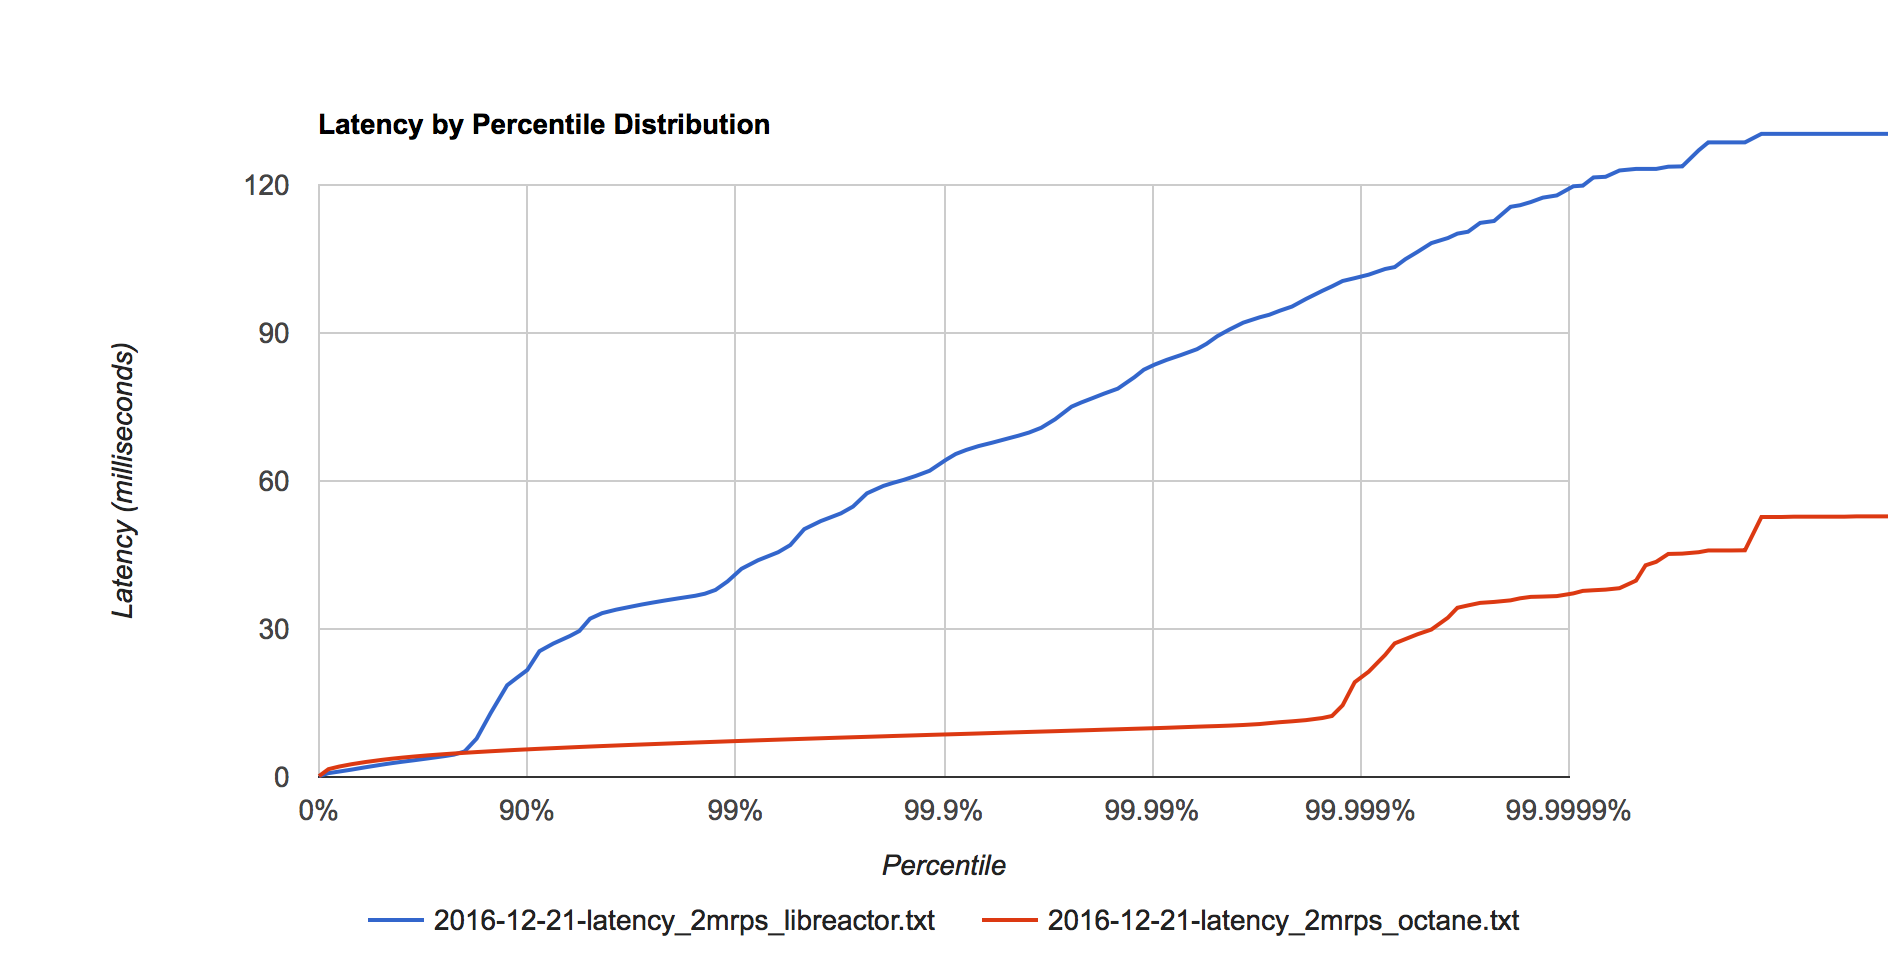 Figure 3. Latency distribution at 2 million requests per second.
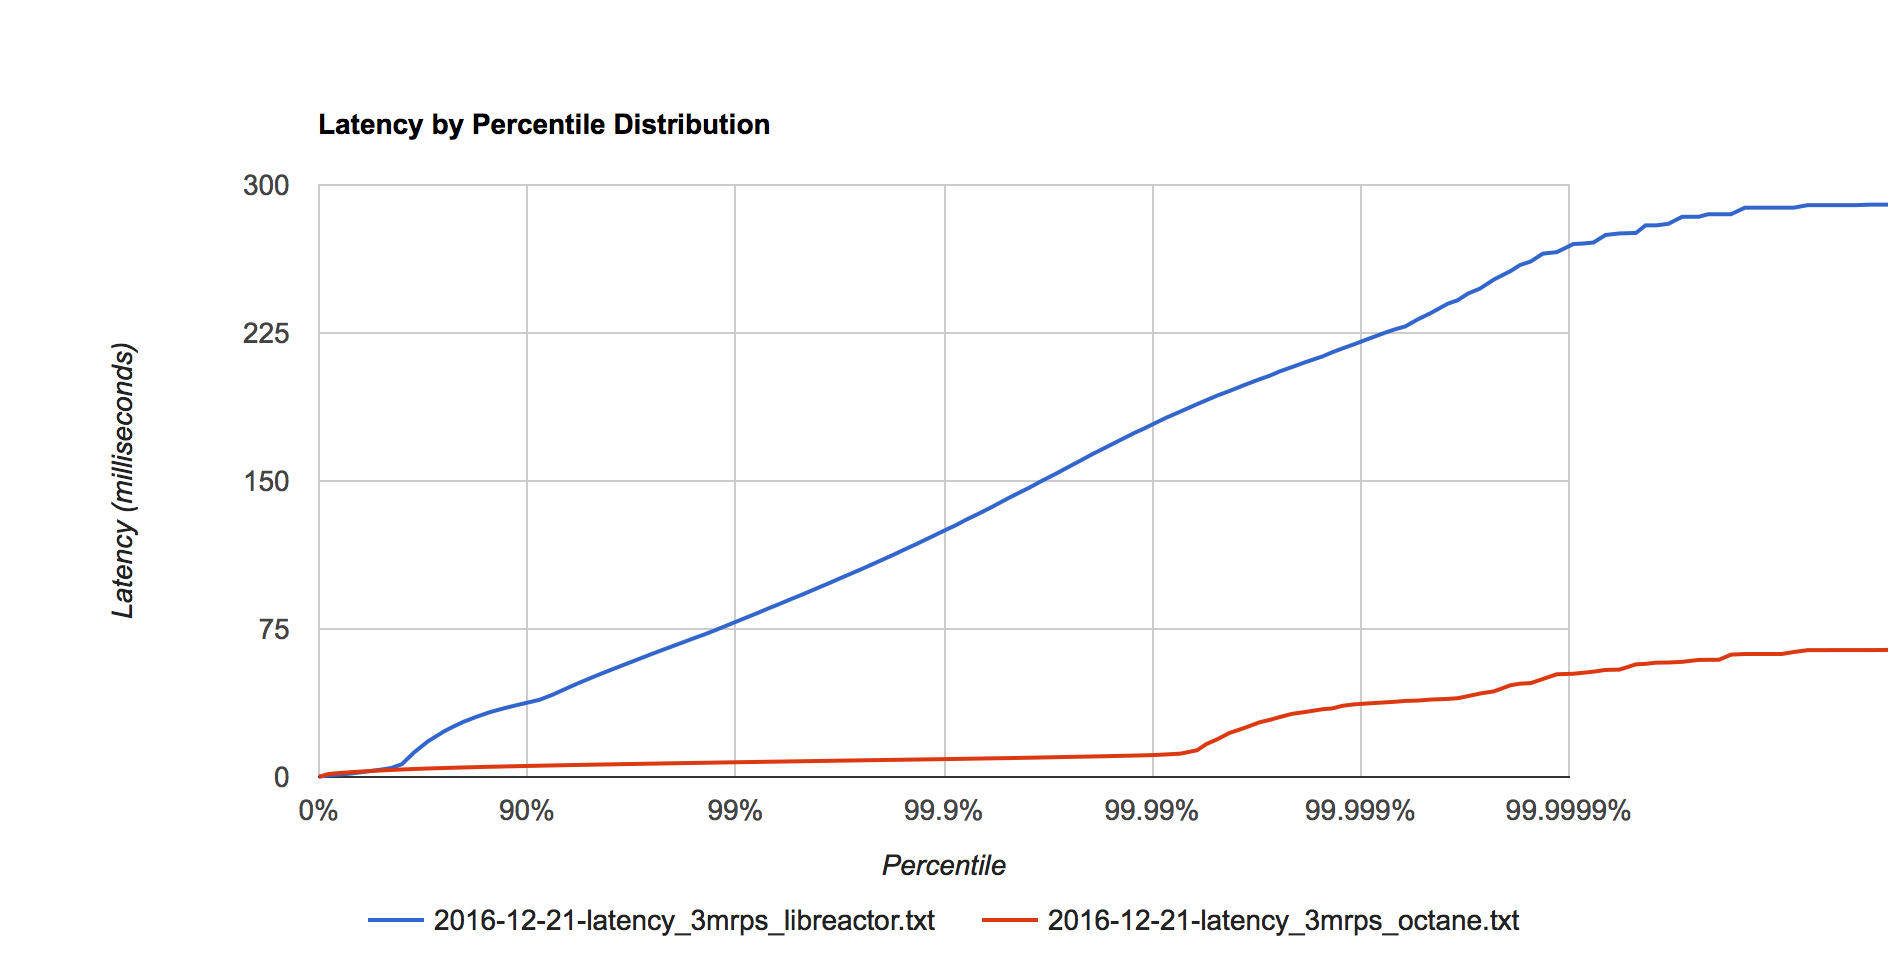 Figure 4. Latency distribution at 3 million requests per second.
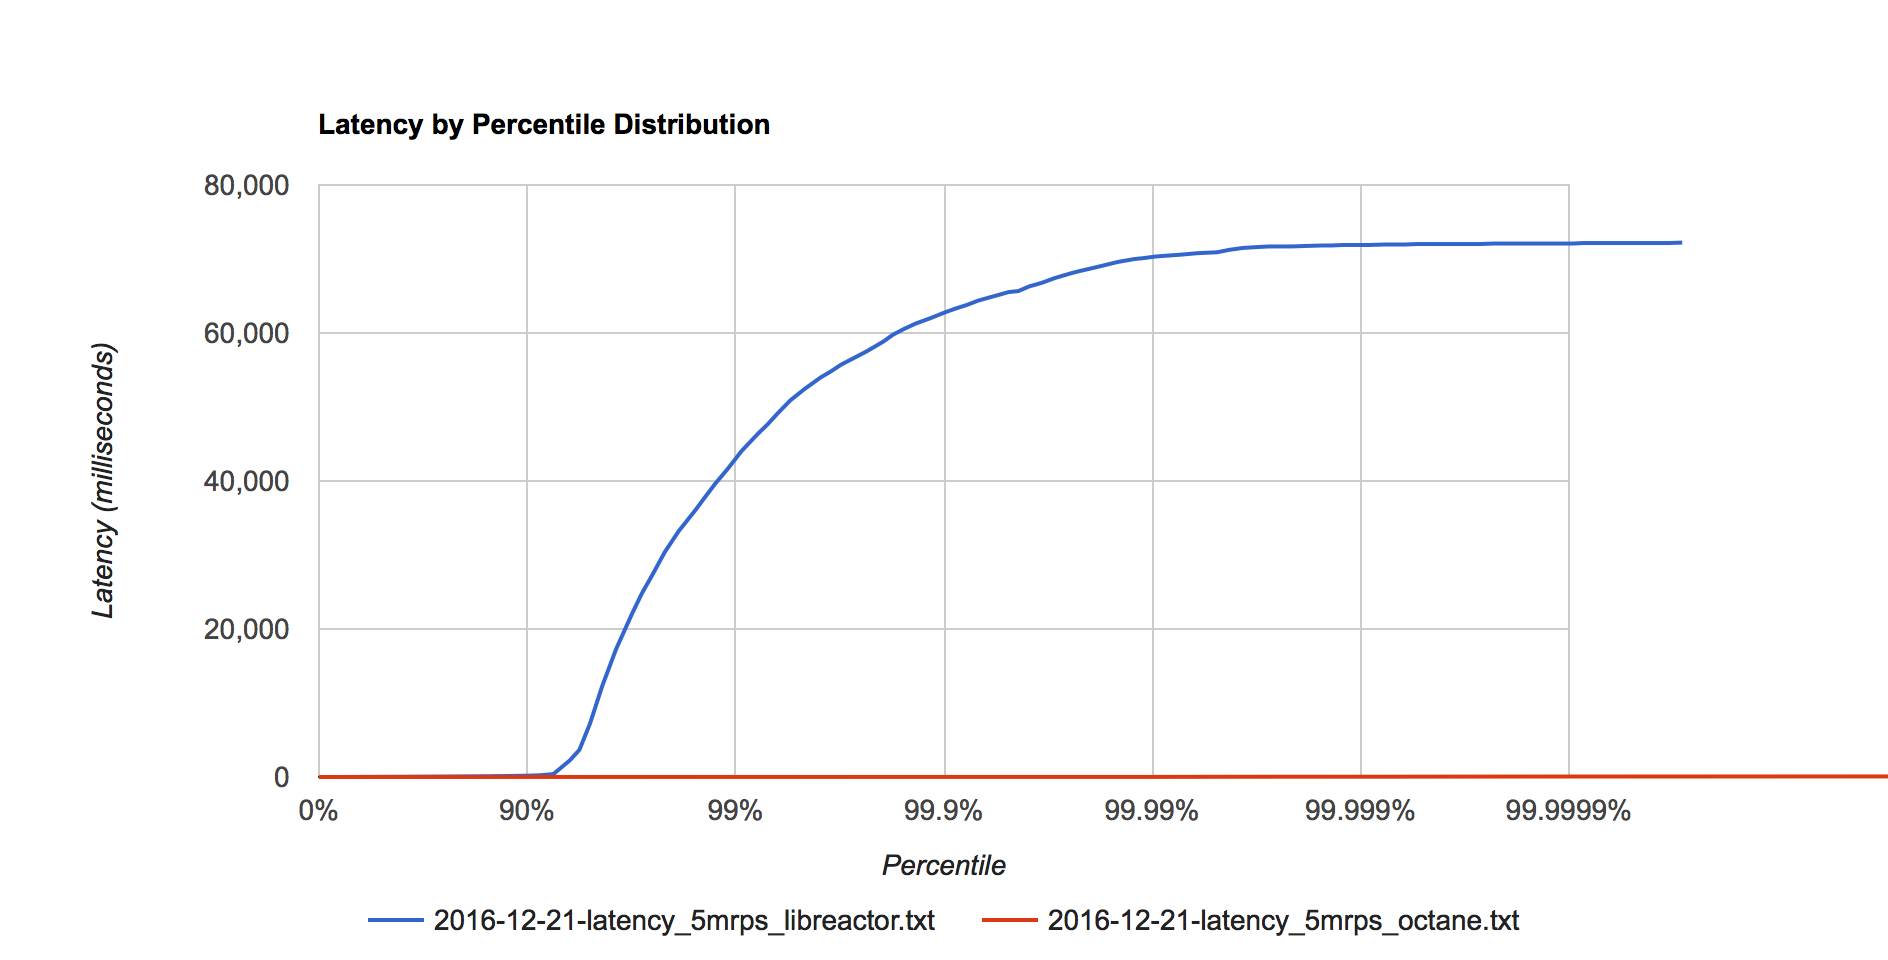 Figure 5. Latency distribution at 5 million requests per second.
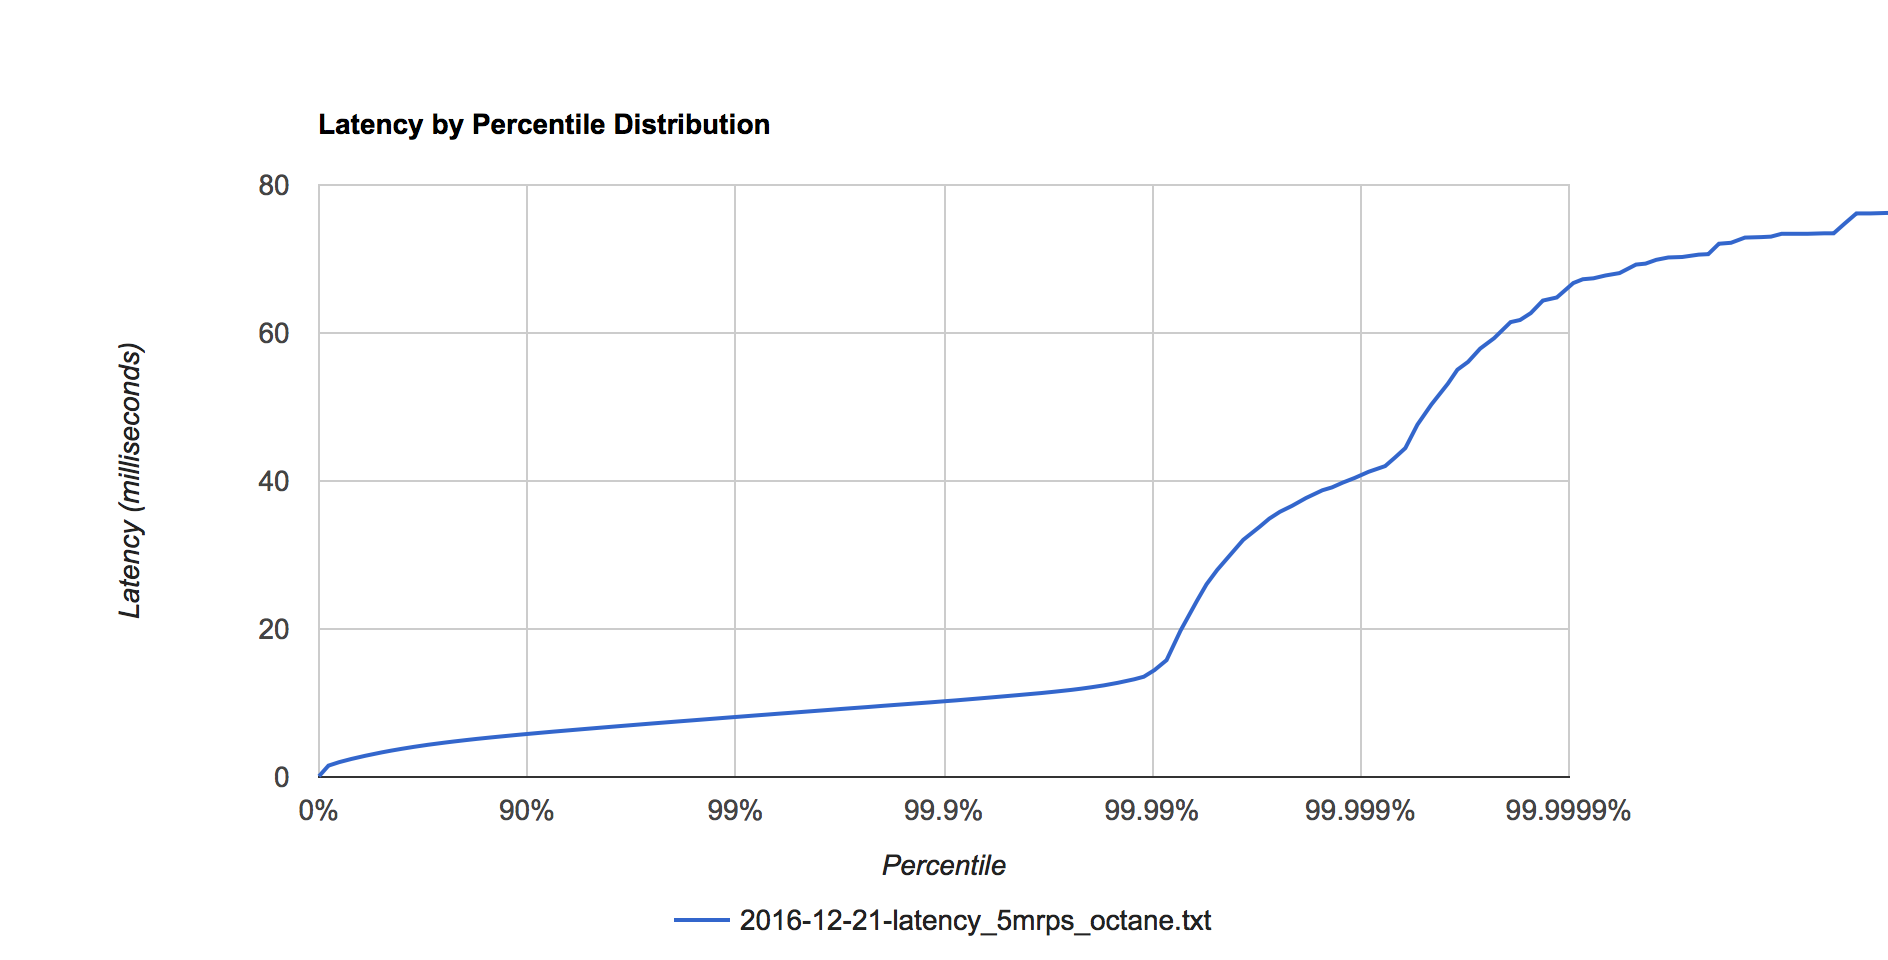 Figure 6. Octane latency distribution at 5 million requests per second.
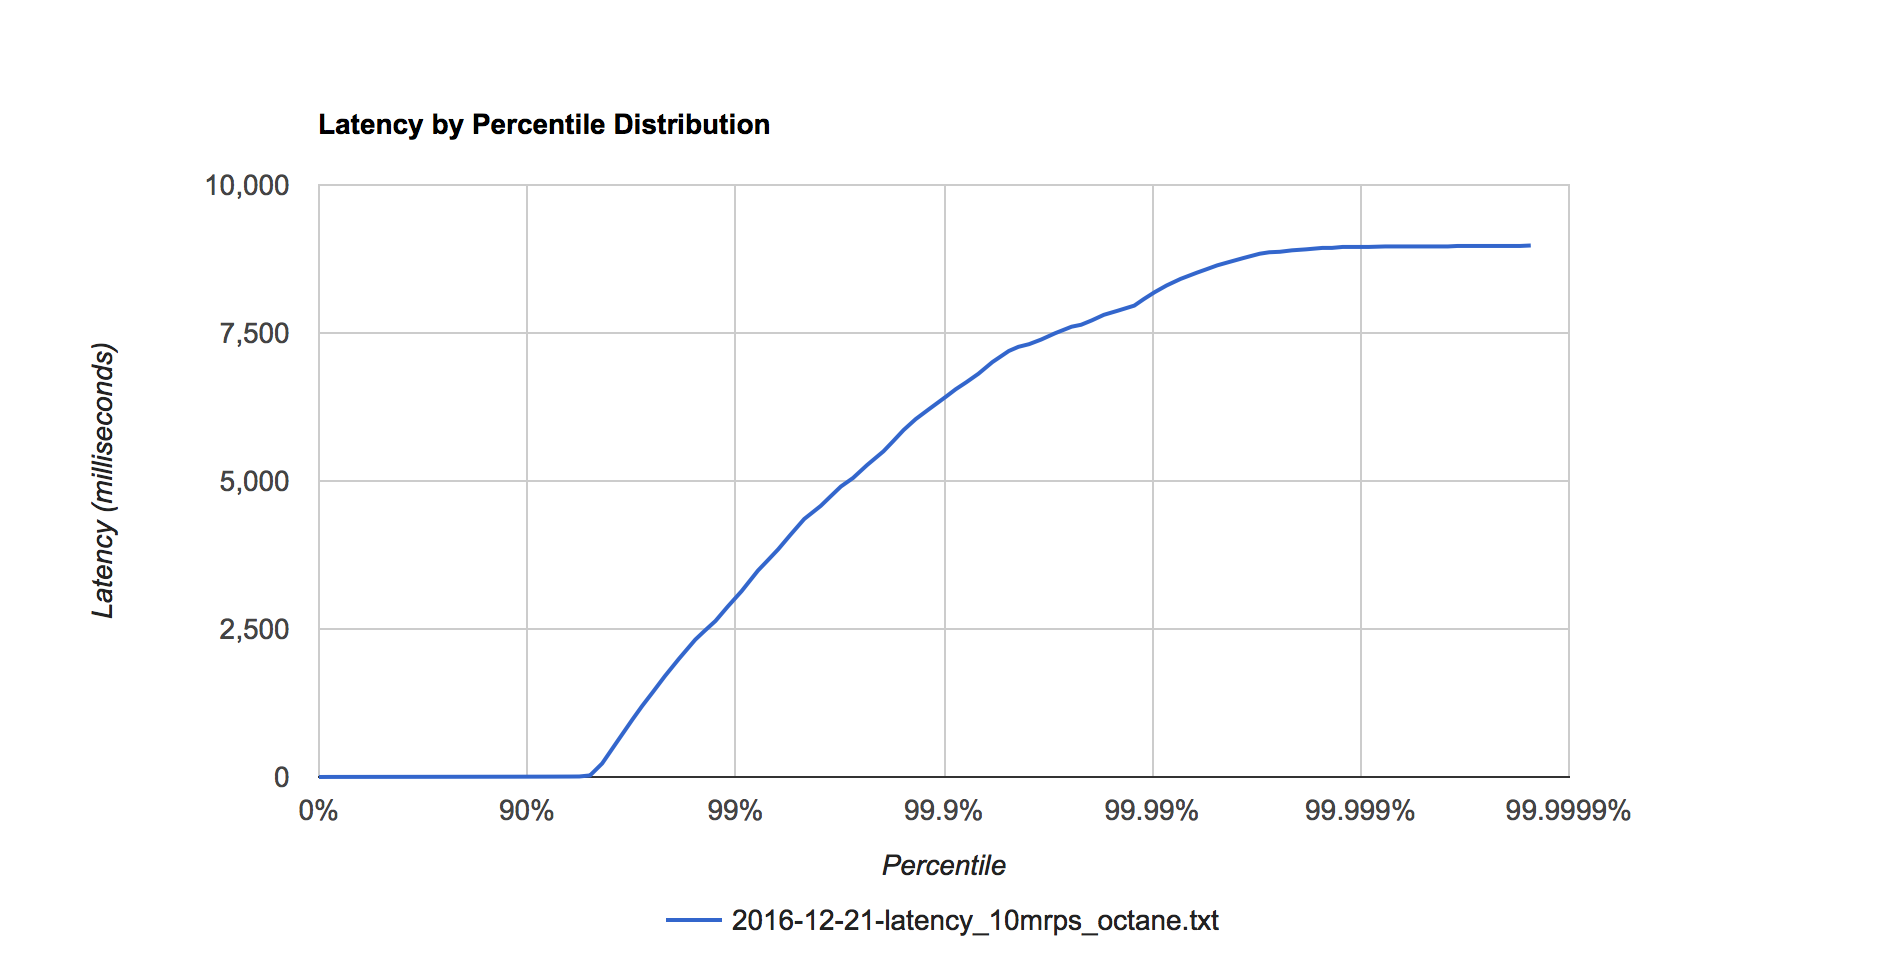 Figure 7. Octane latency distribution at 10 million requests per second.
Final comments
I wanted to publish the work I’ve completed so far but I have plans to continue adding features to octane to make writing high performance services easier to approach.